AERprogress VSD Energy Monitoring: วิธีคำนวณ Specific Power (kW/Nm³/min) และจัดทำรายงาน ISO 50001 สำหรับ Blower ในโรงงานไทย
TL;DR — สรุป 3 ประเด็นหลัก
- AERprogress VSD บันทึกข้อมูล kW + Nm³/min แบบ real-time — คำนวณ Specific Power ต่อ operating hour ได้ทันที โดยไม่ต้องใช้ sensor ภายนอก
- ค่า Specific Power ที่ เพิ่มขึ้นเกิน baseline = สัญญาณ SAE decline (Specific Air Energy) — ตรวจพบล่วงหน้าก่อน breakdown 4–8 สัปดาห์
- รายงานผลประหยัดพลังงานรายเดือนที่สอดคล้อง ISO 50001:2018 สร้างได้จาก AERprogress data export โดยตรง — ผ่าน internal audit ได้โดยไม่ต้องจ้าง consultant
AERZEN ออกแบบระบบ VSD สำหรับ blower และ compressor มาตั้งแต่ยุคแรกของอุตสาหกรรม — และ AERprogress คือการรวม Variable Speed Drive เข้ากับ IIoT telemetry ในหน่วยเดียว ผลที่ได้คือ data stream ที่ครบถ้วนพอจะคำนวณ Specific Power (kW/Nm³/min) ได้ต่อเนื่องตลอด 24 ชั่วโมง บทความนี้ไม่ได้อธิบาย platform architecture ของ AERConnect (ซึ่งครอบคลุมใน pillar หลัก IIoT Remote Monitoring) — แต่จะลงลึกถึง workflow เฉพาะ: วิธีดึงข้อมูล VSD มาคำนวณ energy performance, ติดตาม SAE decline ตาม service hours, และสร้างรายงานที่ ISO 50001 internal auditor ยอมรับ
Specific Power baseline
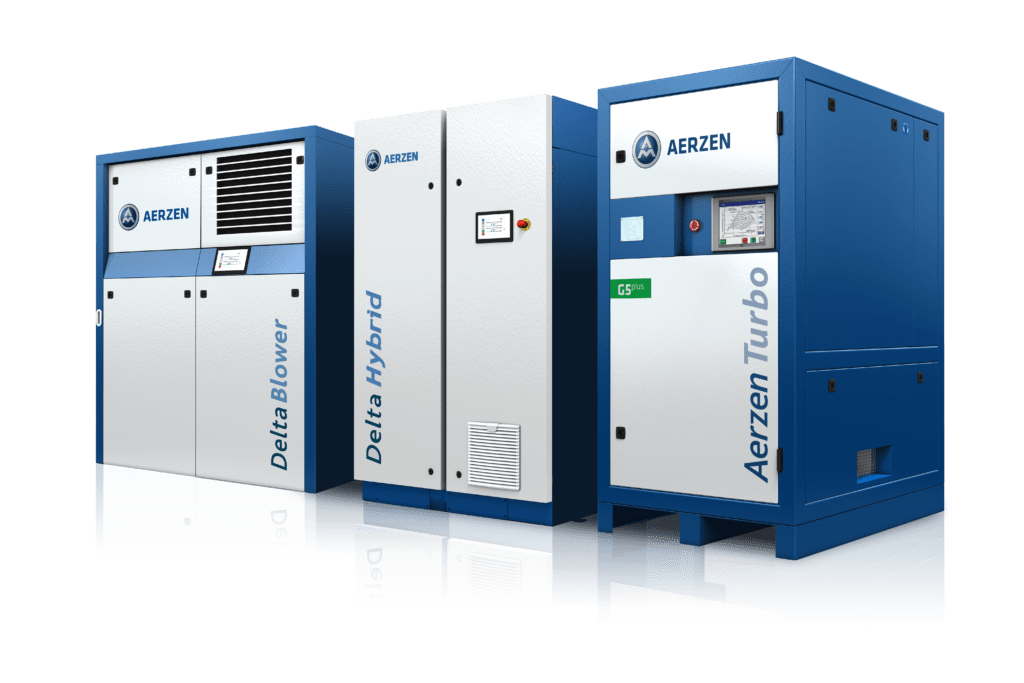
(Delta Hybrid Screw Blower — new unit)
ที่ AERprogress แจ้งเตือน
(ปรับตามโรงงานได้)
ที่รายงาน AERprogress
รองรับโดยตรง
ของ AERprogress
data stream
1. บทความนี้ต่างจาก AERConnect Pillar อย่างไร
การ monitoring ด้วย IIoT มีหลายชั้น — และสิ่งที่ทีมวิศวกรโรงงานมักสับสนคือ platform กับ workflow เป็นคนละเรื่องกัน:
| มิติ | AERConnect / AERScan Pillar (platform & architecture) | บทความนี้ (VSD energy workflow) |
|---|---|---|
| คำถามหลัก | “ระบบ monitoring ทำงานอย่างไร? เชื่อมต่อยังไง?” | “ได้ข้อมูลมาแล้ว — คำนวณ Specific Power และ SAE decline ยังไง?” |
| เนื้อหา | AERConnect architecture, sensor types, SCADA integration, data protocols (Modbus/OPC UA), cloud setup | สูตร kW/Nm³/min, SAE decline curve, 5-step dashboard workflow, ISO 50001 report template |
| ผู้อ่านหลัก | IT/OT engineer, system integrator, เพิ่งประเมิน IIoT | Plant engineer / energy manager ที่ใช้ AERprogress อยู่แล้ว หรือกำลังเตรียม ISO 50001 audit |
| Output | Architecture diagram, protocol list, deployment scope | Monthly energy savings report, SAE trend chart, audit checklist |
ถ้าคุณยังอยู่ในขั้นตอนประเมิน platform — อ่าน AERConnect pillar ก่อน แล้วกลับมาที่นี่เมื่อพร้อมทำ energy workflow
2. สูตรคำนวณ Specific Power — พื้นฐานที่ทุกอย่างยึดตาม
Specific Power (SP) คือตัวเลขเดียวที่บอกว่า blower / compressor ของคุณ “คุ้มค่า” หรือ “เปลือง” ในชั่วโมงนั้น:
Pshaft = shaft power ที่ motor ส่งออก (kW) — อ่านจาก AERprogress VSD power meter
QFAD = Free Air Delivery (Nm³/min) ที่ ISO 1217 reference conditions (1 bar abs, 20°C, 0% RH)
AERprogress ให้ตัวเลขใดบ้างในการคำนวณ?
| Parameter | แหล่งข้อมูล | ความถี่ sampling | ความแม่นยำทั่วไป |
|---|---|---|---|
| Motor shaft power (kW) | AERprogress VSD internal power meter | ทุก 30 วินาที | ±1.5% full scale |
| Motor speed (RPM / Hz) | VSD output frequency register | ทุก 30 วินาที | ±0.1 Hz |
| Outlet pressure (mbar / kPa) | AERprogress pressure transducer | ทุก 30 วินาที | ±0.5% span |
| Inlet temperature (°C) | AERprogress inlet temp sensor | ทุก 30 วินาที | ±0.5°C |
| Flow (Nm³/h — calculated) | AERprogress performance map + speed + pressure model | Derived ทุก 30 วินาที | ±3–5% (model-based) |
3. ข้อมูล VSD ที่ AERprogress Export ออกมาในรูปแบบต่าง ๆ
AERprogress รองรับ 3 channel การส่งออกข้อมูล ซึ่งแต่ละช่องมีบทบาทต่างกันใน energy workflow:
| Export Channel | Protocol / Format | Use Case ใน Energy Workflow | ความถี่ |
|---|---|---|---|
| Modbus TCP | Register map ผ่าน Ethernet | Pull เข้า historian (AVEVA, PI System, Ignition) — คำนวณ SP ใน SCADA | Real-time (poll interval 1–60 วิ) |
| AERConnect Cloud | AERZEN proprietary cloud dashboard | Trend SP ย้อนหลัง, เปรียบเทียบหลายเครื่อง, download CSV สำหรับ audit | Auto-upload ทุก 30 วิ |
| Local HMI + USB Export | CSV / Excel | Backup สำหรับโรงงานที่ไม่มี cloud access — ใช้ทำ monthly report offline | Manual ตามต้องการ |
สำหรับ ISO 50001 internal audit — channel ที่ใช้งานจริงมากที่สุดคือ AERConnect Cloud CSV export เนื่องจาก timestamp ถูก log อัตโนมัติ, มี traceability chain ครบ, และ format พร้อมสำหรับ Excel / Power BI โดยไม่ต้องแปลง
4. SAE Decline: อ่านค่าและตีความให้ถูกต้อง
SAE (Specific Air Energy) คือ Specific Power ที่วัดที่จุด design point ของเครื่อง — ใช้เป็น baseline ตอน commissioning เปรียบเทียบกับค่าที่วัดตลอด service life SAE decline หมายถึง SP ขยับขึ้นเรื่อย ๆ เมื่อเครื่องใช้งานมากขึ้น — ซึ่งเกิดจาก 3 สาเหตุหลัก:
- Bearing wear — แรงเสียดทานเพิ่มขึ้น → shaft power (Pshaft) สูงขึ้นที่ flow เดิม → SP เพิ่ม
- Internal clearance erosion — สำหรับ screw blower / compressor: clearance ระหว่าง rotor กว้างขึ้น → slip flow เพิ่ม → flow จริงลด → SP เพิ่ม
- Filter fouling — inlet restriction เพิ่ม → effective pressure ratio สูงขึ้น → Pshaft สูงขึ้น → SP เพิ่ม
เกณฑ์การตีความ SAE Decline
| SP เพิ่มจาก Baseline | สถานะ | การดำเนินการแนะนำ |
|---|---|---|
| 0–5% | ปกติ | Continue monitoring — บันทึก trend ใน monthly report |
| 5–10% | ดี | เพิ่มความถี่การตรวจ filter — ตรวจสอบว่าเกิดจาก operating condition หรือ wear |
| 10–15% | ต้องติดตาม | Plan preventive maintenance — ตรวจ bearing, filter, belt/coupling alignment |
| 15–25% | ต้องดำเนินการ | Schedule maintenance ภายใน 2–4 สัปดาห์ — อย่ารอจนถึง PM schedule ปกติ |
| > 25% | แจ้งเตือนด่วน | Stop-and-inspect — ความเสียหายเพิ่มเติมมีความเสี่ยงสูง; วางแผน unit swap ถ้าใช้บริการเช่า |
5. Dashboard Workflow: 5 ขั้นตอนจาก VSD Data สู่ Specific Power Dashboard
- Establish Baseline SP ตอน Commissioningทันทีที่ blower/compressor เริ่ม run — บันทึก SP ที่ design flow และ design pressure เป็น commissioning baseline ใน AERConnect หรือ spreadsheet. ค่านี้คือจุดอ้างอิงตลอดอายุเครื่อง — หรือตลอดสัญญาเช่า
- Pull Data ทุก 30 วินาทีผ่าน AERConnect Cloud / ModbusAERprogress stream ข้อมูล kW + Nm³/h + pressure + temperature ทุก 30 วิ — นำเข้า historian (SCADA, PI System, Ignition) หรือ AERConnect cloud dashboard. ถ้าไม่มี historian ใช้ AERConnect built-in dashboard ได้ทันที
- คำนวณ SP แบบ Rolling 1-hour AverageSP แบบ instantaneous มี noise จาก load fluctuation — ใช้ 1-hour rolling average เพื่อ smooth trend. สูตร: SPavg = (Σ Pshaft,i × Δt) ÷ (Σ QFAD,i × Δt) โดย i = แต่ละ 30-second interval ใน 1 ชั่วโมง
- Plot SAE Decline Curve ตาม Runtime Hoursนำ SP hourly average มาวาง X-axis เป็น cumulative runtime hours — เห็น trend curve ทันที เปรียบ baseline กับค่าปัจจุบัน คำนวณ % deviation อัตโนมัติ. AERConnect มี built-in trend view — export CSV ได้สำหรับ Excel/Power BI
- ตั้ง Alert Threshold ใน AERConnect หรือ SCADAตั้ง alert ที่ SP ≥ baseline + 15% (ค่า default AERZEN) — AERprogress จะแจ้งเตือนผ่าน email/SMS/dashboard ก่อนที่ breakdown จะเกิดขึ้น 4–8 สัปดาห์โดยเฉลี่ย (จาก AERZEN field data)
6. จัดทำรายงาน ISO 50001 Monthly Energy Savings Report
ISO 50001:2018 (Energy Management Systems) กำหนดให้องค์กรระบุ Significant Energy Use (SEU) และติดตาม Energy Performance Indicators (EnPI) อย่างต่อเนื่อง — blower / compressor มักจะเป็น SEU อันดับต้น ๆ ของโรงงาน (โดยเฉพาะอุตสาหกรรม water treatment, food & beverage, electronics ที่ใช้ compressed air ตลอด 24 ชั่วโมง)
รายงานที่ AERprogress data สนับสนุนโดยตรง (ตาม ISO 50001:2018 clause 6.6 + 9.1):
| ส่วนของรายงาน ISO 50001 | ข้อมูลจาก AERprogress | ตำแหน่งใน Clause |
|---|---|---|
| Energy Consumption Summary | Total kWh ต่อเดือน จาก VSD energy meter — แยกตามเครื่อง | Clause 6.6 — Energy Baseline |
| EnPI: Specific Power Trend | SP (kW/Nm³/min) monthly average + YoY comparison | Clause 6.4 — Energy Performance Indicators |
| Improvement vs. Baseline | % ลด SP เทียบ baseline (หรือเทียบปีก่อน) | Clause 9.1 — Monitoring & Measurement |
| Maintenance Link | Service event log + SP recovery หลัง PM — แสดง maintenance ROI | Clause 8.3 — Design & Procurement |
| Corrective Action Evidence | Alert timestamp + action taken + SP ลดหลัง corrective maintenance | Clause 10.1 — Nonconformity & Corrective Action |
ตัวอย่างโครงสร้างรายงานรายเดือน (1 เครื่อง)
ข้อมูลทั้งหมดมาจาก AERprogress data export (CSV) ผ่าน AERConnect — ไม่มีการอ่านค่า manual
714 h (จาก 720 h calendar — uptime 99.2%)
124,800 kWh (avg. 174.8 kW load)
1,984 Nm³/h (33.1 Nm³/min)
0.0880 kW/Nm³/min (+12.8% vs baseline 0.0780)
WATCH — ตรวจ filter + bearing ในรอบ PM ถัดไป
+12.8% × 124,800 kWh = 15,975 kWh เกิน baseline
(คำนวณเป็น THB ตามอัตราค่าไฟจริง — ระบุใน template ของโรงงาน)
ตรวจ inlet filter + ตรวจ bearing vibration ก่อน 30 มิ.ย. 2026
EnPI in acceptable range (threshold: +15%) — no nonconformity this month
7. ข้อได้เปรียบของ Rental ใน Energy Monitoring Workflow
โรงงานที่ซื้อ blower/compressor เองมักเจอ gap สำคัญ: เครื่องรุ่นเก่าไม่มี AERprogress VSD built-in — ทำให้ไม่มีข้อมูล energy ที่ละเอียดพอสำหรับ ISO 50001 หรือ ESG reporting. การเช่าจาก AERZEN Rental Thailand แก้ปัญหานี้ใน 3 มิติ:
| มิติ | ซื้อเครื่องรุ่นเก่า (ไม่มี VSD/IIoT) | เช่า AERZEN — AERprogress built-in |
|---|---|---|
| Energy data | ไม่มี real-time kW data — ต้องติด submeter เพิ่ม (ค่าใช้จ่ายและความผิดพลาดเพิ่มขึ้น) | พร้อมใช้ทันที — AERprogress VSD data ครบตั้งแต่วันแรก |
| SAE baseline | ไม่มี factory baseline — ต้องทำ acceptance test เองก่อน | มี factory data sheet — baseline SP จาก AERZEN factory acceptance test ตาม ISO 1217 |
| Unit swap เมื่อ SAE decline สูง | ซ่อม/เปลี่ยนชิ้นส่วนเอง — downtime ไม่แน่นอน | Swap within 24h — SLA 24h mobilization ป้องกัน production loss |
| ค่า CAPEX | สูง — ต้องซื้อทั้งเครื่อง + VSD + IIoT sensor เพิ่มเติม | Zero CAPEX — OPEX เท่านั้น สอดคล้องกับ CFO requirement |
| ISO 50001 audit evidence | ต้องรวบรวม data จากหลายแหล่ง — effort สูง | Single CSV export จาก AERConnect — พร้อมส่ง auditor |
8. คำถามที่พบบ่อย (FAQ)
AERprogress วัด flow จริง หรือแค่คำนวณ? ใช้สำหรับ ISO 50001 ได้ไหม?
AERprogress คำนวณ flow (Nm³/h) จาก performance map + motor speed + pressure — ไม่ใช่ direct measurement จาก flow meter. สำหรับ ISO 50001 internal energy reporting และ trend monitoring ความแม่นยำ ±3–5% นี้เพียงพอสำหรับการติดตาม EnPI แบบ relative (% change จาก baseline)
ถ้า auditor ต้องการ absolute measurement สำหรับ EnPI baseline ที่ต้องรายงานภายนอก (เช่น TGO carbon footprint) — แนะนำให้ทำ one-time calibration test ตาม ISO 1217 Annex E เพื่อ anchor AERprogress model กับ measured value
SAE decline +15% เกิดจากอะไรได้บ้าง — และต้องทำอะไรก่อน?
ลำดับการตรวจสอบที่แนะนำ (ไปตามความน่าจะเป็นสูงสุด → ต่ำสุด):
- Inlet air filter — ตรวจ differential pressure ข้ามกรอง ถ้า > spec → เปลี่ยน filter ก่อนอื่น (แก้ได้ 60–70% ของกรณี SP เพิ่ม)
- Cooling system — ตรวจ coolant level + cooler fouling → อุณหภูมิสูงเพิ่ม specific work
- Bearing condition — ดู vibration trend จาก AERprogress → spike หรือ trending up = bearing wear
- Internal clearance — ถ้า SP สูงขึ้นเรื่อย ๆ แม้ทำ 1-3 แล้ว → overhaul เพื่อตรวจ rotor clearance
โรงงานที่ใช้ BVO Blower (ไม่ใช่ Delta Hybrid) มี AERprogress ไหม?
AERprogress พร้อมใช้ใน Delta Hybrid Screw Blower, BVS Screw Blower, และ TVO Oil-Free Screw Compressor ทุกรุ่น. BVO (Rotary Lobe Blower) รุ่นเก่าที่ไม่มี VSD อาจต้องประเมินการติดตั้ง VSD retrofit หรือเปลี่ยนมาใช้รุ่น BVO ที่รองรับ AERprogress VSD — ติดต่อทีม AERZEN Rental Thailand เพื่อประเมิน compatibility ของรุ่นที่ใช้งานอยู่
ข้อมูล AERprogress integrate กับ SAP PM / Maximo ได้ไหม?
ได้ — ผ่าน 2 path:
- Modbus TCP → OPC UA Gateway → SAP PM — ทีม IT/OT ของโรงงานตั้ง gateway เอง (AERprogress รองรับ OPC UA optional)
- AERConnect API → middleware → SAP — ใช้ RESTful export จาก AERConnect cloud เชื่อมกับ SAP Integration Hub หรือ Azure/AWS IoT Hub
AERZEN ไม่ได้เป็น SAP implementation partner — แต่ทีมวิศวกรสามารถให้ข้อมูล register map + data schema สำหรับ IT/OT integrator ของโรงงาน
Subscription Plan ของ AERZEN Rental รวม energy reporting service ไว้ด้วยไหม?
Subscription Plan all-inclusive ของ AERZEN Rental Thailand ครอบคลุม hardware (blower/compressor + AERprogress VSD), maintenance, service calls, และ AERConnect platform access. การจัดทำรายงาน ISO 50001 เป็น service ที่สามารถ request ได้เพิ่มเติมจากทีม AERZEN — ติดต่อสอบถามรายละเอียดแพ็กเกจได้ที่ทีมงาน
ขอข้อมูล Specific Power Baseline และ AERprogress Energy Workflow
ทีมวิศวกร AERZEN Rental Thailand พร้อมช่วยกำหนด energy baseline, ออกแบบ dashboard workflow, และเตรียม data structure สำหรับ ISO 50001 internal audit ของโรงงานคุณ
Rent a solution. Expect performance. — AERZEN Rental Thailand · 36/60 Phlu Ta Luang, Sattahip, Chon Buri 20180
Last technical review: 2026-06-03 · Reviewed by AERZEN Rental Thailand Engineering Team ·
ข้อมูล AERprogress specifications อ้างอิงจาก AERZEN HQ product documentation
· ISO 50001:2018 clause references ตาม ISO.org

✍️ เกี่ยวกับผู้เขียน
ภราดร วรรณสังข์ (Paradorn Wannasung)
Marketing Communication Specialist · นิเทศศาสตรมหาบัณฑิต (การสื่อสารการตลาดและแบรนด์)
ภราดร (Paradorn) เป็นผู้ดูแลด้านการสื่อสารการตลาดของ AERZEN Rental Thailand จบนิเทศศาสตรมหาบัณฑิต (การสื่อสารการตลาดและแบรนด์) เชี่ยวชาญด้านอุตสาหกรรม B2B ในประเทศไทย มีประสบการณ์การสร้างแบรนด์และคอนเทนต์ในกลุ่มอุตสาหกรรมของไทย
ติดต่อ: pwa@aerzenrental.com · LinkedIn
บทความที่เกี่ยวข้อง

เช่า vs ซื้อ Blower/Compressor — กรอบตัดสินใจ TCO 9 รายการ สำหรับโรงงานไทย
กรอบตัดสินใจ TCO 9 ร...
อ่านต่อ →
เช่า Blower Compressor สมุทรสาคร: Oil-Free สำหรับอาหารทะเลแปรรูปและห้องเย็น
สมุทรสาครเป็นศูนย์กล...
อ่านต่อ →
หัวข้อหลัก: ประสิทธิภาพพลังงานและการลดค่าไฟ