System Resistance Curve (H-Q) คืออะไร: วิธีคำนวณ System Curve จากท่อเพื่อหา Operating Point ของ Blower
- System resistance curve (H-Q) คือเส้นโค้งที่แสดงความดันสูญเสียของระบบท่อที่ทุก flow rate — เมื่อตัดกับ blower performance curve (P-Q) จาก manufacturer จะได้ operating point เพียงจุดเดียว
- คำนวณด้วย Darcy-Weisbach: ΔP = f × (L/D) × (ρv²/2) รวมกับ equivalent length ของ fitting แต่ละชิ้น ตามอ้างอิง Crane TP-410
- ถ้า system curve สูงกว่า blower curve — blower จะทำงาน off-design: flow ต่ำกว่า spec, อุณหภูมิสูง, surge risk — rental unit สามารถเปลี่ยน pressure-matched ได้ทันที
AERZEN ออกแบบ blower มาตั้งแต่ปี 1864 และบทเรียนที่ซ้ำที่สุดในการติดตั้งภาคสนามคือ: blower ที่ถูกต้องบน system ที่คำนวณผิด ยังคงทำงาน off-design อยู่ดี. System resistance curve (H-Q) คือเครื่องมือที่วิศวกรใช้ตรวจสอบว่า network ของท่อ, ข้อต่อ, และ diffuser จะต้านทานการไหลมากแค่ไหนที่แต่ละค่า flow rate — จุดที่เส้นนี้ตัดกับ blower performance curve (P-Q) ของ manufacturer คือ operating point จริงของระบบ ไม่ใช่ตัวเลขที่เห็นใน datasheet เพียงอย่างเดียว. บทความนี้อธิบาย concept, สูตร Darcy-Weisbach, ตาราง equivalent length ของ fitting และแสดง step-by-step ตัวอย่างจากงาน WWTP aeration ring main ซึ่งเป็นงานที่พบบ่อยที่สุดในประเทศไทย.
บทความนี้เป็นส่วนหนึ่งของ คู่มือออกแบบและคำนวณขนาด Blower อุตสาหกรรม (คู่มือหลัก) — อ่านคู่มือหลักเพื่อครอบคลุมทุก dimension ของการออกแบบระบบ
1. Operating Point เกิดขึ้นได้อย่างไร
Blower ทุกรุ่นมี performance curve (P-Q curve) จาก manufacturer — เส้นโค้งที่แสดงว่าที่ flow rate (Q) ใดๆ blower จะสร้าง pressure (P หรือ Δp) เท่าไหร่. แต่ pressure ที่ blower ต้องสร้างจริงขึ้นอยู่กับ system resistance — แรงต้านทานของท่อ, fitting, และอุปกรณ์ปลายทาง (เช่น diffuser ใน aeration tank).
System resistance curve (H-Q curve) คือเส้นโค้งที่คำนวณจากระบบท่อ โดยทั่วไปมีลักษณะ parabolic: ยิ่ง flow rate สูง แรงต้านทานก็ยิ่งสูงขึ้นตามกำลังสอง (ΔP ∝ v² ∝ Q²). เมื่อ plot ทั้งสองเส้นบน graph เดียวกัน จะมีจุดตัดเพียงหนึ่งจุด — นั่นคือ operating point: ค่า flow rate และ pressure ที่ระบบจะทำงานจริง.
หาก system curve ถูกคำนวณผิด (เช่น ลืมนับ equivalent length ของ elbow หรือประเมิน backpressure ของ diffuser ต่ำเกินไป) — operating point จะเลื่อนออกจาก design point. Blower อาจส่ง flow ต่ำกว่า spec โดยไม่มี alarm ใดๆ จนกว่าจะวัดจริง
2. สูตร Darcy-Weisbach และตัวแปรในงาน Industrial Blower
สูตร Darcy-Weisbach เป็น foundation ของการคำนวณ pressure drop ในท่อ ได้รับการยืนยันว่าแม่นยำที่สุดสำหรับ turbulent flow ใน industrial piping — อ้างอิงจาก Crane Technical Paper TP-410 (Flow of Fluids Through Valves, Fittings, and Pipe) ซึ่งเป็น reference มาตรฐานของวิศวกรระบบ piping ทั่วโลก:
f = Darcy friction factor (dimensionless) — ขึ้นกับ Reynolds number และ pipe roughness
L = ความยาวท่อ (m) — รวม equivalent length ของ fitting ทุกชิ้น
D = Diameter ภายในท่อ (m) — ใช้ inside diameter จาก pipe schedule
ρ = Density ของอากาศที่เงื่อนไขใช้งาน (kg/m³) — ที่ 35°C, 1 atm ≈ 1.146 kg/m³
v = Flow velocity ในท่อ (m/s) = Q (m³/s) / A (m²) เมื่อ A = π × (D/2)²
ในงาน industrial blower ประเทศไทย unit ที่ใช้บ่อยที่สุดคือ Pa (Pascal) หรือ mbar. ความสัมพันธ์: 1 mbar = 100 Pa = 0.1 kPa. Blower สำหรับ WWTP aeration ทั่วไปทำงานที่ system resistance ประมาณ 30–80 kPa (300–800 mbar) รวม hydrostatic head ของน้ำในถัง aeration.
สภาพอากาศไทยสูงกว่า standard condition (20°C, 1 atm): ที่ 35°C, 101.325 kPa → ρ ≈ 1.146 kg/m³ (vs 1.204 kg/m³ ที่ 20°C). ความต่างนี้ส่งผลโดยตรงต่อ ΔP และต้องถูกนำมาใช้ในการคำนวณ system curve ก่อนเลือก blower ทุกครั้ง — โดยเฉพาะในพื้นที่ EEC ที่อุณหภูมิ inlet อาจสูงถึง 38–42°C ในช่วงฤดูร้อน
3. วิธีหา Friction Factor (f) สำหรับท่อโลหะ
Darcy friction factor (f) หาได้จาก Moody chart หรือ Colebrook-White equation. สำหรับงาน aeration blower ที่ velocity ทั่วไปอยู่ที่ 10–20 m/s ใน pipe (Reynolds number Re > 100,000 → fully turbulent) สามารถใช้ค่าประมาณ simplified ตาม ISO 5801:2017 ได้:
| ประเภทท่อ | Roughness (ε) mm | f โดยประมาณ (DN150–DN300, turbulent) | หมายเหตุ |
|---|---|---|---|
| Carbon steel (ใหม่) | 0.046 | 0.018–0.022 | ใช้ทั่วไปสำหรับ aeration header |
| Carbon steel (aged 10+ ปี) | 0.15–0.30 | 0.022–0.028 | เพิ่ม 15–25% เพื่อ safety margin |
| Stainless steel (304/316) | 0.015 | 0.017–0.020 | WWTP ที่ต้องการ corrosion resistance |
| uPVC / HDPE | 0.005–0.015 | 0.016–0.019 | ใช้บ่อยใน diffuser ring สำหรับน้ำเสียชุมชน |
| Galvanized steel | 0.15 | 0.022–0.026 | อายุน้อย ค่า roughness ต่ำกว่า aged carbon steel |
สำหรับ scope งาน standard WWTP aeration — ท่อ carbon steel ใหม่ DN150–DN300 ที่ turbulent flow — ใช้ค่า f = 0.020 เป็นค่าเริ่มต้นในการคำนวณ H-Q curve ได้โดยไม่ต้องคำนวณ Reynolds number ทุกจุด (conservative estimate ที่ยอมรับได้ใน pre-engineering stage)
4. ตาราง Equivalent Length ของ Fitting ทั่วไป
Fitting แต่ละชิ้นสร้าง pressure loss เทียบเท่ากับท่อตรงยาวเท่าใดเท่าหนึ่ง — เรียกว่า equivalent length (Le) โดยทั่วไปแสดงในรูป Le/D (อัตราส่วนต่อ diameter). ค่าต่อไปนี้อ้างอิงจาก Crane TP-410 สำหรับ turbulent flow ใน ductile iron / carbon steel fitting มาตรฐาน:
| Fitting / Valve | Le/D (turbulent) | Le สำหรับ DN200 (D=0.206 m) | หมายเหตุ |
|---|---|---|---|
| Elbow 90° (standard radius) | 30 | 6.18 m | ใช้บ่อยที่สุดใน ring main aeration |
| Elbow 90° (long radius 1.5D) | 16 | 3.30 m | Le ต่ำกว่า — แนะนำเมื่อมี space |
| Elbow 45° | 16 | 3.30 m | |
| Tee (flow through run) | 20 | 4.12 m | ผ่านตรง flow loss ต่ำกว่า branch |
| Tee (flow through branch) | 60 | 12.36 m | แยก branch — pressure loss สูงกว่ามาก |
| Gate valve (fully open) | 8 | 1.65 m | เมื่อปิดบางส่วน Le พุ่งขึ้น 50–200× |
| Butterfly valve (fully open, 10°) | 45 | 9.27 m | ใช้บ่อยใน aeration ring — ระวัง position ที่ 30° Le ≈ 160 |
| Check valve (swing) | 100 | 20.60 m | pressure loss สูง — ต้องนับทุกตัว |
| Check valve (wafer/silent) | 50 | 10.30 m | ทางเลือกที่ pressure loss ต่ำกว่า swing type |
| Reducer (concentric, 2:1) | 15 | 3.09 m | ที่จุด transition diameter |
| Globe valve (fully open) | 340 | 70.04 m | ห้ามใช้ใน blower discharge line |
Globe valve มี Le/D สูงมาก (≈340) — equivalent length เกือบ 70 m สำหรับ DN200 เพียงตัวเดียว. หากพบใน blower discharge line ให้ตรวจสอบและเปลี่ยนเป็น gate valve หรือ butterfly valve ทันที. Globe valve บน blower line เป็นสาเหตุที่พบบ่อยของ unexplained high back-pressure และ blower overheating
5. ตัวอย่างคำนวณ: WWTP Aeration Ring Main DN200 ยาว 150 m
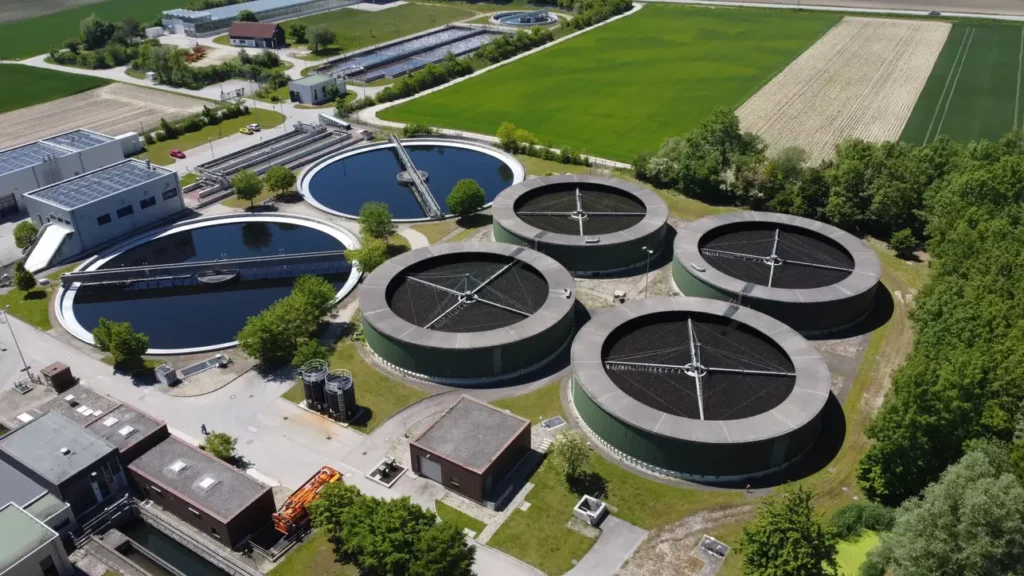
งาน WWTP aeration ring main เป็น application ที่พบบ่อยที่สุดในประเทศไทยสำหรับ industrial blower rental — โรงบำบัดน้ำเสียขนาดกลาง (1,000–5,000 m³/วัน) ทั้งในนิคมอุตสาหกรรม EEC, สมุทรปราการ, และราชบุรี. ตัวอย่างนี้แสดง step-by-step การคำนวณ system curve แล้วหา operating point บน blower curve.
ข้อมูล Design Condition
| Parameter | Value | หน่วย |
|---|---|---|
| Flow rate (design point) | 2,500 | m³/h (= 0.694 m³/s) |
| Pipe diameter (DN200) | D = 0.206 | m (inside diameter, schedule 40) |
| Pipe length (straight) | 150 | m |
| Fitting: Elbow 90° standard | 4 ชิ้น | Le/D = 30 ต่อชิ้น |
| Fitting: Butterfly valve (fully open) | 2 ชิ้น | Le/D = 45 ต่อชิ้น |
| Fitting: Check valve (wafer) | 1 ชิ้น | Le/D = 50 |
| Air temperature (inlet) | 35 | °C → ρ = 1.146 kg/m³ |
| Friction factor (f) | 0.020 | dimensionless (carbon steel, DN200) |
| Diffuser backpressure | 35,000 | Pa (35 kPa) — กำหนดจาก membrane diffuser spec |
Step-by-Step การคำนวณ System Resistance
-
Step 1: คำนวณ Total Equivalent Length (Ltotal)
รวมท่อตรงกับ equivalent length ของ fitting ทุกชิ้น:
Elbow 90° × 4: Le = 4 × 30 × 0.206 = 24.72 m
Butterfly valve × 2: Le = 2 × 45 × 0.206 = 18.54 m
Check valve × 1: Le = 1 × 50 × 0.206 = 10.30 m
Ltotal = 150 + 24.72 + 18.54 + 10.30 = 203.56 m
-
Step 2: คำนวณ Cross-Sectional Area และ Velocity
A = π × (0.206/2)² = π × (0.103)² = 0.03341 m²
v = Q / A = 0.694 / 0.03341 = 20.8 m/s
(velocity ปกติสำหรับ gas blower discharge: 15–25 m/s)
-
Step 3: คำนวณ Pipe Friction Pressure Drop (ΔPpipe)
ΔPpipe = f × (Ltotal / D) × (ρ × v² / 2)
ΔPpipe = 0.020 × (203.56 / 0.206) × (1.146 × 20.8² / 2)
ΔPpipe = 0.020 × 988.2 × (1.146 × 432.64 / 2)
ΔPpipe = 0.020 × 988.2 × 247.8
ΔPpipe = 4,897 Pa ≈ 4.9 kPa
-
Step 4: รวม Total System Resistance ที่ Design Point
ΔPsystem = ΔPpipe + ΔPdiffuser + ΔPstatic
ΔPsystem = 4,900 + 35,000 + 5,000 (hydrostatic: น้ำลึก 0.5 m)
ΔPsystem = 44,900 Pa ≈ 44.9 kPa ≈ 449 mbar
นี่คือ pressure ที่ blower ต้องสร้างที่ Q = 2,500 m³/h
-
Step 5: Plot H-Q Curve (System Curve) ที่หลาย Flow Rate
เนื่องจาก ΔP ∝ v² ∝ Q² — คำนวณที่ Q อื่นๆ:
Q = 1,250 m³/h: ΔPpipe ≈ 4,900 × (1250/2500)² = 1.2 kPa → Total ≈ 41.2 kPa
Q = 2,000 m³/h: ΔPpipe ≈ 4,900 × (2000/2500)² = 3.1 kPa → Total ≈ 43.1 kPa
Q = 3,000 m³/h: ΔPpipe ≈ 4,900 × (3000/2500)² = 7.1 kPa → Total ≈ 47.1 kPa
เส้น system curve จะ “แบน” ในช่วงนี้เพราะ diffuser backpressure (35 kPa) เป็น dominant term
ที่ Q = 2,500 m³/h: System resistance = 44.9 kPa (449 mbar)
Blower ที่เหมาะสม: ต้องสร้าง ≥ 45 kPa ที่ Q = 2,500 m³/h — ค้นหาจาก BVS Delta Hybrid catalog ที่ P-Q curve ผ่านจุดนี้
Operating point จะอยู่ที่: จุดตัดของ system curve กับ P-Q curve ของ blower ที่เลือก — ถ้า blower สร้างได้มากกว่า จะ deliver Q เกิน design; ถ้าน้อยกว่า จะ deliver Q ต่ำกว่า spec
ในงานจริงแนะนำให้เพิ่ม safety margin 10–15% บน system resistance ที่คำนวณได้ — เผื่อ aging factor ของท่อ, fouling บน diffuser, และ variation จาก design condition. ดังนั้น blower ที่เลือกสำหรับตัวอย่างนี้ควรสร้างได้ที่ประมาณ 50–52 kPa ที่ 2,500 m³/h
6. ผลของ System Resistance สูงเกินไปต่อ Blower
สถานการณ์ที่พบบ่อยในภาคสนาม: system resistance จริงสูงกว่าที่คำนวณไว้ตอน design — เกิดจาก pipe diameter เล็กกว่า spec, diffuser fouling สะสม, หรือ backpressure จากอุปกรณ์ปลายทางสูงกว่าที่คาด. ผลที่ตามมา:
| สาเหตุ | ผลต่อ Operating Point | อาการที่สังเกตได้ | ระยะเวลาก่อนเสียหาย |
|---|---|---|---|
| Pipe diameter เล็กกว่า design (velocity สูงเกิน) | System curve ชันขึ้น → Operating point เลื่อนซ้าย (flow ลด, pressure เพิ่ม) | Flow ต่ำกว่า spec, discharge temperature สูง | ทันที — ตรวจพบด้วย manometer |
| Diffuser fouling / scaling | Backpressure ถาวรเพิ่มขึ้น → System curve ทั้งเส้นขยับขึ้น | Flow ลดลงเรื่อยๆ แบบ gradual, DO ใน tank ลด | หลายเดือน — มักพบตอน audit หรือ DO measurement |
| Butterfly valve ปิดบางส่วน (30–50°) | Le พุ่งขึ้น 3–10× → System resistance เพิ่มมาก | Flow ลดฉับพลัน, Blower ampere อาจลด (ไม่ใช่สัญญาณดี — หมายถึง flow ลด) | ทันที |
| System resistance สูงกว่า blower curve (ทุก Q) | ไม่มี intersection → Blower เข้า surge/stall | Vibration, pulsation, overheating — alarm trigger | นาที — เสี่ยง catastrophic failure |
สำหรับ centrifugal blower (AerzenTurbo AT series) และ screw blower (BVS Delta Hybrid) — การทำงานที่ flow ต่ำกว่า surge line เป็นอันตราย. หาก system resistance คำนวณผิดและ blower ถูก operated ทางซ้ายของ surge point จะเกิด pressure pulsation, vibration สูง, และอุณหภูมิ bearing พุ่งขึ้น. ตรวจสอบ system curve ก่อน commissioning ทุกครั้ง
7. Rental Solution: เปลี่ยน Unit ที่ Pressure-Matched ได้ทันที
เมื่อ System Curve ไม่ตรงกับ Blower ที่มีอยู่
ความจริงในภาคสนาม: ระบบท่อที่ติดตั้งแล้วแก้ไขได้ยาก — เปลี่ยน diameter, เพิ่ม bypass, หรือตัด fitting ออกมีต้นทุนสูงและใช้เวลา. แต่ blower เปลี่ยนได้เร็วกว่ามาก.
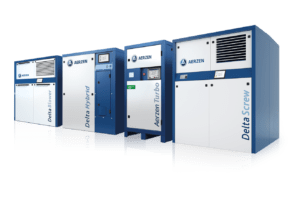
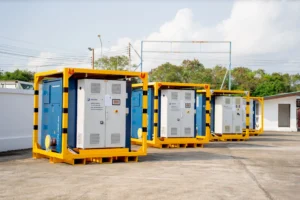
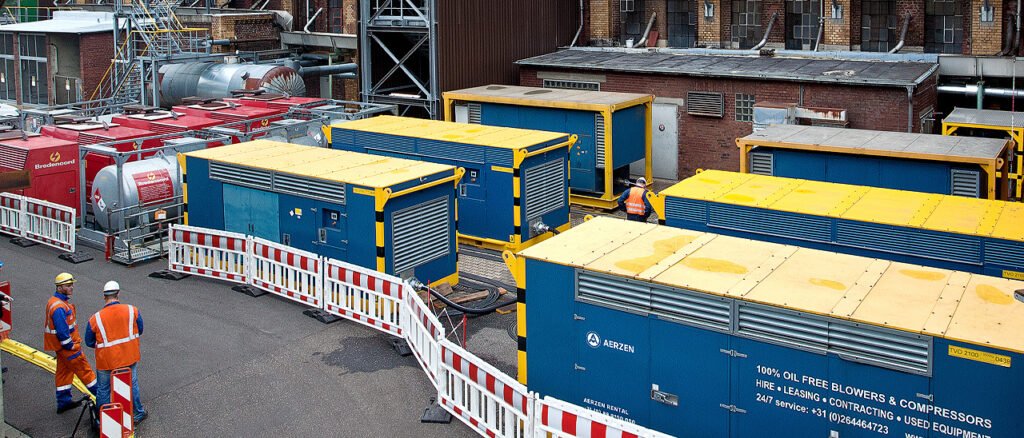
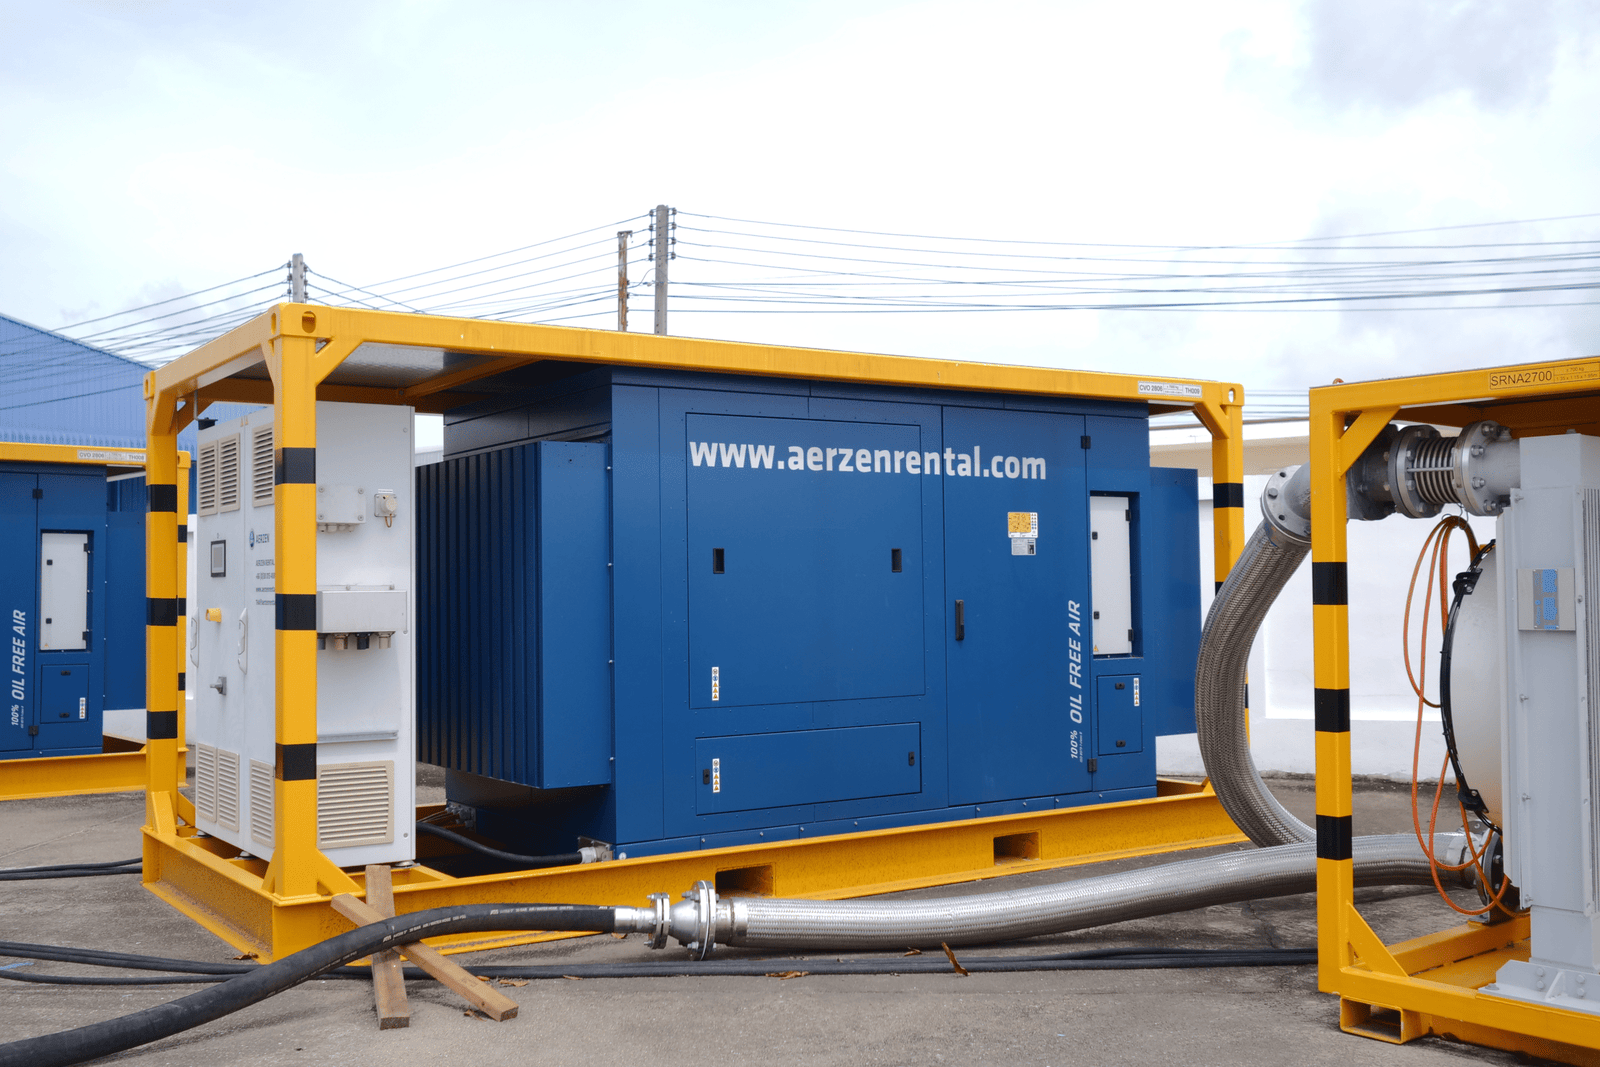
AERZEN Rental Thailand มี portfolio ครอบคลุม BVS Delta Hybrid (0.3–1.5 bar, 400–9,000 m³/h), BVO (positive displacement blower, 0.3–1.0 bar, 60–3,000 m³/h), และ DVO oil-free screw (0.3–1.5 bar, 500–7,500 m³/h) — ทุก series มีหลาย pressure-flow range ให้เลือก matching กับ system curve จริงของโรงงาน.
วิศวกร AERZEN จะช่วยวิเคราะห์ system curve จากข้อมูลท่อที่มี แล้วเลือก unit ที่ operating point ตรงกับ design requirement — mobilization ภายใน 24–48 ชั่วโมง จาก Sattahip EEC depot.
อ่านคู่มือออกแบบระบบ blower ฉบับสมบูรณ์ → | ขอใบเสนอราคาพร้อมวิเคราะห์ System Curve →
8. FAQ สำหรับวิศวกร
ต่างกันอย่างไรระหว่าง H-Q curve ของ blower กับ H-Q curve ของระบบท่อ?
Blower performance curve (P-Q หรือ H-Q จาก manufacturer) คือ capability ของ blower — ที่ flow rate ใดๆ blower สร้าง pressure ได้เท่าไหร่ตาม design. เส้นนี้ขึ้นกับ machine design + speed + inlet condition.
System resistance curve (H-Q จากการคำนวณ) คือ demand ของระบบท่อ — ที่ flow rate ใดๆ ระบบต้องการ pressure เท่าไหร่เพื่อเอาชนะ friction + fittings + backpressure. เส้นนี้ขึ้นกับ pipe geometry เท่านั้น ไม่ขึ้นกับ blower.
จุดตัดของสองเส้น = operating point ที่ระบบจะทำงานจริง
ถ้าไม่รู้ค่า f ที่แน่นอน ใช้ค่าอะไรในการประมาณ?
สำหรับ pre-engineering estimate ของ carbon steel pipe DN100–DN400 ที่ turbulent flow: ใช้ f = 0.020–0.022 เป็น conservative estimate. ในงานจริงถ้าต้องการความแม่นยำสูงให้คำนวณ Reynolds number (Re = ρvD/μ) แล้วใช้ Moody chart หรือ Colebrook-White equation: 1/√f = -2 log₁₀(ε/(3.7D) + 2.51/(Re√f))
เพิ่ม safety factor 15% บนค่า ΔP ที่ได้เพื่อเผื่อ aged pipe + fouling เสมอ
Equivalent length ของ fitting เปลี่ยนตาม pipe size ไหม?
ค่า Le/D (อัตราส่วน) คงที่ตามประเภท fitting (ค่าจาก Crane TP-410). แต่ Le ในหน่วย meter เปลี่ยนตาม pipe diameter: Le = (Le/D) × D. ดังนั้น elbow 90° standard บน DN200 (D=0.206m) มี Le = 30 × 0.206 = 6.18 m — แต่บน DN300 (D=0.319m) จะมี Le = 30 × 0.319 = 9.57 m. ต้องคำนวณ Le แยกตาม pipe section ที่ใช้ diameter ต่างกัน
System curve ของ WWTP aeration ทำไมถึง “แบน” กว่า pneumatic conveying?
เพราะ WWTP aeration มี static pressure component ที่ dominant (diffuser backpressure + hydrostatic head ของน้ำในถัง) ซึ่งค่อนข้างคงที่ตาม flow rate — ทำให้ system curve แบนในช่วง operating flow. Pneumatic conveying ส่วนใหญ่ไม่มี static pressure term ขนาดนี้ — ความดันสูญเสียมาจาก pipe friction เกือบทั้งหมด ทำให้ system curve ชัน (parabolic มากกว่า). ผลคือ blower สำหรับ WWTP sensitive กับ flow variation น้อยกว่า แต่ sensitive กับ diffuser fouling มากกว่า
ควรคำนวณ H-Q curve ที่กี่จุดเพื่อ plot?
อย่างน้อย 5–7 จุด ครอบคลุมตั้งแต่ 50% จนถึง 130% ของ design flow rate. จุดที่สำคัญที่สุดคือ design point (100%) และ minimum flow point (50–60%) เพื่อตรวจสอบว่า operating point ไม่เข้า surge zone ที่ part-load. สำหรับระบบที่ต้องใช้ VFD ควร plot system curve เพิ่มที่ minimum speed ด้วย
ถ้าระบบมี diffuser fouling สะสม ต้องทำอย่างไร?
Diffuser fouling เพิ่ม backpressure ถาวร → system curve ทั้งเส้นขยับขึ้น → operating point เลื่อนซ้าย (flow ลด). ตรวจสอบด้วยการวัด discharge pressure ที่ blower outlet และเปรียบเทียบกับ design value. ถ้าสูงกว่า design 10–15% ให้ clean diffuser ก่อน. ถ้า fouling รุนแรงและ clean ไม่ได้ ทางเลือกคือ (1) เปลี่ยน blower เป็น unit ที่มี higher pressure capability หรือ (2) ลด diffuser ทีละส่วนเพื่อ restore flow. AERZEN rental unit สามารถ swap เป็น pressure-matched unit ได้ภายใน 24–48 ชั่วโมงหาก pressure requirement เปลี่ยน
ปรึกษาการคำนวณ System Curve กับวิศวกร AERZEN
Rent a solution. Expect performance.
ทีม Application Engineer ของ AERZEN Rental Thailand ช่วยวิเคราะห์ system resistance curve จากข้อมูลท่อ และเลือก blower unit ที่ pressure-matched กับระบบจริงของคุณ — พร้อม mobilization ภายใน 24–48 ชั่วโมง

✍️ เกี่ยวกับผู้เขียน
ภราดร วรรณสังข์ (Paradorn Wannasung)
Marketing Communication Specialist · นิเทศศาสตรมหาบัณฑิต (การสื่อสารการตลาดและแบรนด์)
ภราดร (Paradorn) เป็นผู้ดูแลด้านการสื่อสารการตลาดของ AERZEN Rental Thailand จบนิเทศศาสตรมหาบัณฑิต (การสื่อสารการตลาดและแบรนด์) เชี่ยวชาญด้านอุตสาหกรรม B2B ในประเทศไทย มีประสบการณ์การสร้างแบรนด์และคอนเทนต์ในกลุ่มอุตสาหกรรมของไทย
ติดต่อ: pwa@aerzenrental.com · LinkedIn
บทความที่เกี่ยวข้อง

Nm³/h กับ m³/h สลับกันทำให้เช่าเครื่องเล็กไป: แปลงหน่วยลมให้ถูกก่อนขอใบเสนอราคา
Nm3/h vs m3/h สลับหน...
อ่านต่อ →